When developing your employee satisfaction survey, you will need to determine the type of data required for your research. The ‘type’ of data you select will determine what types of tables and charts you can produce for your employee survey.
Ordered Category Data is one that you might consider. Also referred to as Ordinal Data, it is usually obtained from rating scale questions, but, also from closed questions with ordered categories.
Here are some examples of Order Category Data (Ordinal Data) for your Employee Satisfaction Survey:
How Satisfied Are You with the Following Aspects of Your Job: (Rating Scale)
|
Very Satisfied |
Satisfied |
Ok |
Dissatisfied |
Very Dissatisfied |
|
| Medical Benefits |
4 |
10 |
27 |
15 |
4 |
| Hours of Work |
12 |
12 |
15 |
7 |
3 |
| Facility |
30 |
8 |
10 |
2 |
1 |
| Compensation |
5 |
15 |
22 |
10 |
7 |
| Coworkers |
5 |
23 |
15 |
12 |
5 |
What distance is your commute from home to office? (Closed Answer with Ordered Category)
| 0 – 2 miles | |
| 2.1 – 5 miles | |
| 5.1 – 10 miles | |
| 10.1 miles or greater |
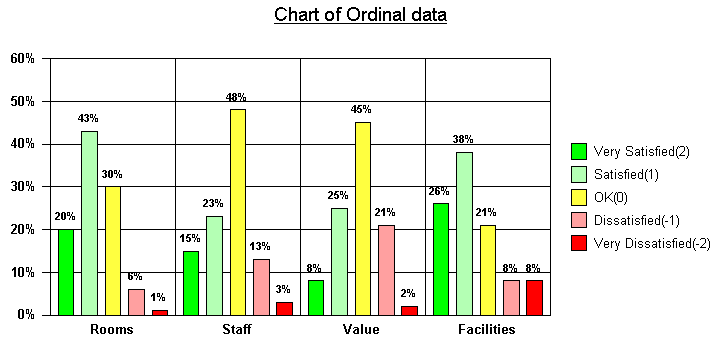
Ordinal Data can also be used to produce tables and charts using counts and percentages.
Numeric values can also be assigned to the categories to produce mean and median values when evaluating your employee satisfaction surveys.
In addition to reviewing data types for your human resources survey, you can also visit our Human Resources Survey page.


