Creating a simple report
You can create your own reports. You can add easily add text, images and analyses to your reports. You can run your report as often as you like, using the latest data to produce an up-to-date report. Once you have set up the report the way you like it, it will be produced like that every time you run it, with no chance of errors creeping in through copying or cut and paste.
There are three steps to creating your own reports. They are shown below, based on the crocodile survey provided with Snap.
- Step 1: Creating the report This example shows you how to create a simple title page
- Step 2: Adding content This example shows you how to add an existing analysis to your report
- Step 3: Running your report You can create much more sophisticated reports using dynamic text, filtered analyses and conditional content.
Step 1: Creating the report
This step shows you how to create a new report and add three instructions to create a title page.
- Click
 on the toolbar to open the Reports window. You will see the three default reports.
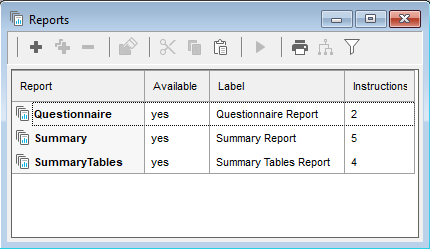
- Click
 to create a new report. By default this will have a Tailor Analysis instruction in and nothing else.
 - Click
 on the report dialog and select Information from the drop-down menu to add a new Information instruction.
 - Click in the text pane.
- Click Insert and select Image… from the list of options.
- Click Browse and select an image file. The example shows the Crocodile Rock Cafe banner.
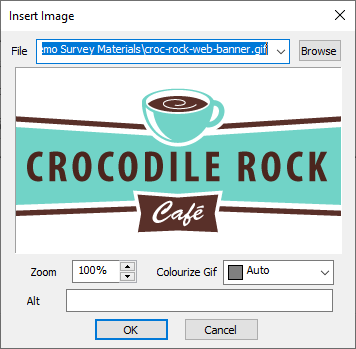
- Click OK to insert the image.
- Click OK in the Information dialog to save the instruction.
- Click
 on the Report dialog to insert another Information instruction.
 - Enter the title for your report in the text pane. (Report on the Crocodile Restaurant). Leave the Title field blank (this is the title of the Instruction.). Style your title text by selecting the text and using the format buttons. The example below has been set to 28pt bold text

- Click OK to keep your title.
- Click
 on the report dialog and select Page Layout from the drop-down menu.
 - Select Start New Page and click OK. This will put a page break in your report after the title page.
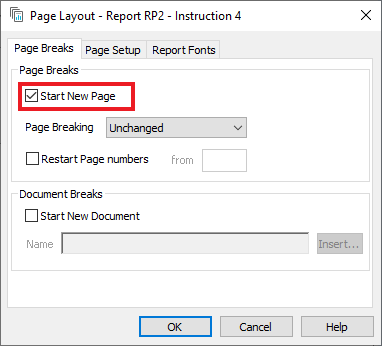
- Click OK to save the instruction.
Step 2: Adding content to your report
This step shows you how to add some text and an analysis to your report. Although you can create analyses directly in a report, it is a good idea to create any analyses you want first, so you can check that they are the way you want.
- Click
 on the report dialog and select Information from the drop-down menu to add a new Information instruction.
 - Enter your text to describe your report.
- Click OK to keep your introduction.
- Click
 on the report dialog and select Execute from the drop-down menu to add a new Execute instruction.
 - Expand the Execute field and select the analyses you want, in this example AN14 (the radar chart) is selected.
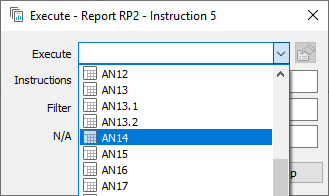
- Click OK to add the Execute instruction to the report.
- Click
 to save the report.
Step 3: Running your report
- Click the
 button on the report window toolbar to run the report.
 - It is often a good idea to check your report on screen rather than sending it to a printer. You can check what it will look like by clicking Preview.
- You can also save the report to a file by choosing any print to file option available in the print settings.
- Click OK to close the printer window and then click OK to run the report.
- You can see that there is information about the chart between the last information instruction and the chart itself. You can stop those appearing by changing the Analysis Definition for the chart
- Click
 on the Snap toolbar to open the Analyses window.
 - Open the chart AN15.
- Click on Properties
 to open the Analysis Definition. Select the Report Styles tab.
 - Clear the Reports Include options (the Description, Notes and Title were set in the sample survey).
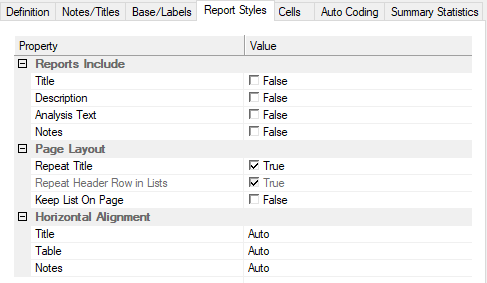
- Click OK to save your changes.
- Click
 on the report window bar to and run the report again.
 - Your report will now look something like this.