Defining an analysis (table, chart, list, cloud or map)
- Select the toolbar button for the type of analysis you wish to create:
 table
table chart
chart cloud
cloud list
list map
map
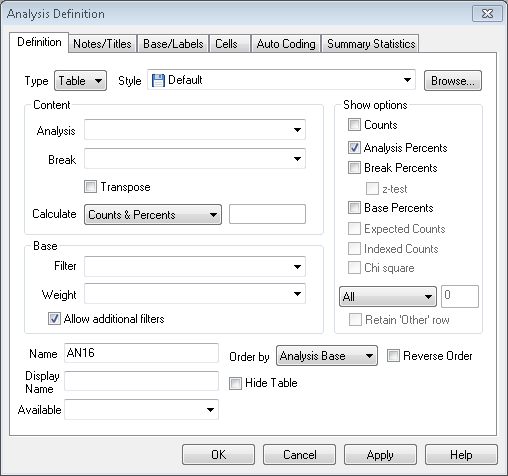
- The Analysis Definition dialog will be displayed.

- The Analysis Definition dialog has several tabs, allowing you to set the analysis you are using, and precisely what is displayed and in which style.
- The main items you are likely to use are on the Definition tab. Other options will be enabled according to the type of analysis you are carrying out.
|
Area |
Description |
| Type and Style | The Type specifies whether it is a table, chart, list or map, and the Style references a list of predefined presentation formats. These can be altered and saved for use in future surveys. |
Content (Analysis, Break & Calculate) | You enter the names of the variables you wish to display in the Analysis field. If you wish to relate them to a different set of variables, (cross-tabulation) you enter the second set in the Break field. The Analysis field normally specifies the rows of a table and the Break normally specifies the columns. The Calculate field provides six alternative forms of analysis, with Counts & Percents as the default. You can use lists and ranges of variables in the content field modified by expressions. |
Base | You can change whether the analysis is calculated from all respondents or all responses (eg all codes selected for a single question, or the one respondent who selected them) in the Base/Labels tab |
Transpose | Present the analysis as columns and the break as rows |
Base | You can select which cases you wish to use by applying a filter.You can make some cases count more than others (to match the cases more closely to a population) by applying a weight. |
Show Options | The default value is Counts (number of cases), but means, percentages, significances and differences can be incorporated. |
Name | A unique name to identify each analysis |
Title | You can change the default title for your analysis using the Notes/Titles tab |
You can add informative text around your analysis using the Notes/Titles tab.
You can change the text labelling the analysis items on the Base/Labels tab