Confidence intervals in tables
You can display confidence statistics in tables. These show how confident you can be that a specified proportion of the population lie within a calculated range. The confidence intervals are available in the Summary Statistics tab of the Analysis Tailoring dialog.
Confidence intervals on percentage values
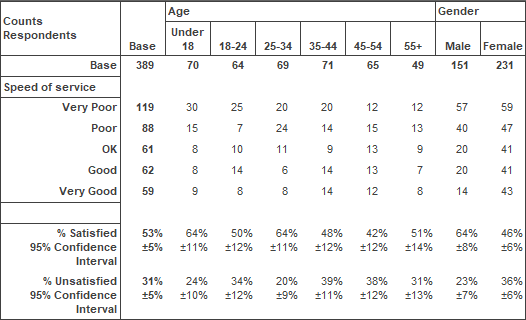
The most common use of confidence intervals is when creating groups from a ratings scale. The table below shows a ratings scale for speed of service, broken down by age and gender.
It includes a satisfied scale, which is the percentage of respondents who selected either “Very Good” or “Good”. For the Base column in the table below, you can be 95% confident that the percentage of respondents in the target population satisfied with “Speed of Service” is in the range (53 – 5)% and (53 + 5)%; that is, between 48% and 58%. The size of margins varies according to the sample size and will generally be reduced with larger samples.

You have control over the following aspects:
- whether to show the Confidence Interval statistics (as above)
- the Level of Confidence
- which categories of the row variable represent the required group
How the confidence interval is calculated
Using an example of a question which:
- has 5 codes (“Very Good”, “Good”, “OK”, “Poor”, “Very Poor”)
- with a base of 389 respondents
- 53% of the respondents said that the service was “Very Good” or “Good” and the remaining 47% chose the other 3 categories
You can then calculate the confidence interval as follows:

The 95% confidence level has a constant of 1.96.
In the example, this gives:
i.e., a Confidence Interval of ± 5%
You can be 95% confident that 53% (± 5%) of the population are “Very Satisfied” or “Fairly Satisfied” with the service provided.
If tables are weighted then the calculation of the Confidence Interval will be based on the weighted results not the original cases.
Confidence intervals on means with scoring systems
The mean value is the value for the sample using a numerical scoring system for responses. The confidence interval is the likely range of mean values for the target population.
Using an example of a question which has 5 codes (“Very Good”, “Good”, “OK”, “Poor”, “Very Poor”), with a base of 204 respondents which uses a scoring system of: +2 for Very Good to – 2 for Very Poor the mean value and standard deviation will be calculated using these scores. You can then calculate the confidence interval as follows:
