Creating a table using a scoring system
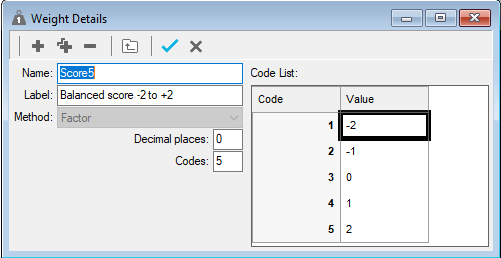
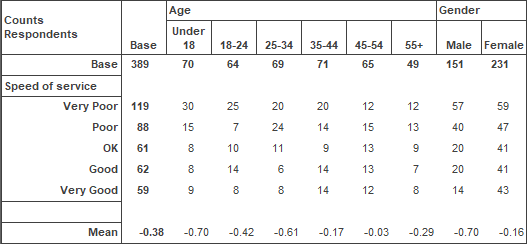
The example shows how to apply a score to calculate the mean value of a service. It is applied to a single rating question (with a Single Response) in a cross-tabulation. The different ratings are labelled as Very good (scored as +2) down to Very poor (scored as -2). This example assumes that you have already created the score via the Weights window.

-
Click
 to display the Analysis Definition dialog box.
- Type into the Analysis (and Break) field the names of the variables on which you want to measure confidence. For example, type Q6a in the Analysis field and Q11:Q12 in the Break field.
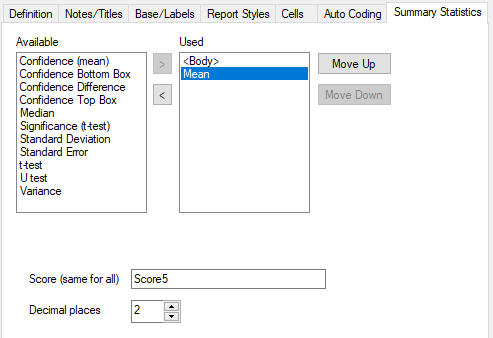
- Click on the Summary Statistics tab.
- Select Mean in the Available list and click > to move it to the Used column.
- Enter the name of the previously created Weight, Score5 in the Score field.

- Click OK to display the table. Note that the score label has been added to the window title.

To display the confidence level for these statistics, go to the Summary Statistics tab of the Analysis Definition dialog and move Confidence (mean) into the Used pane. By default the confidence level is set to 95%.