Using Significance (t-test) in tables
The Significance (t-test) allows us to compare the significance of the mean of each column of data with the significance of the mean of the base.
For example, in the Crocodile Rock Cafe survey it might be required to see whether there is a significant difference in perception of speed of service between different age groups.
-
Click
 to open the analysis Definition dialog to build a table.
- Specify the Analysis variable for the table as Q6c (Rating of Parking).
- Specify the Break variable for the table as Q11 (Age range).
- Click the Summary Statistics tab.
- Select Significance (t-test) in the Available column and click on the > button to move the option into the Used column.
- Select Mean and click on > to move it into the Used column.
-
Specify Score5 as the score. (Score5 is the name given to a Weight
 created in the Crocodile Rock Cafe survey.)
- Click OK to build the table.

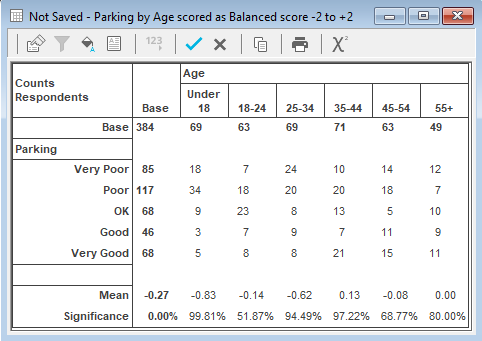
The table shows the counts and percentages of each age group against the rating of speed of service. It also shows the mean rating of speed of service as specified by each age group, and the t-test (significance of the mean) in each category compared with the t-test (significance of the mean) of the base. The significance is shown as a percentage, so if we use the 95% and 99% significance levels as our markers we can see that the under 18s and 35-44 age groups have highly significant results, which means these results are likely to be repeatable in other surveys. The other age categories are not showing significant results and would not necessarily be repeated if the survey was conducted again with a similar group.