Creating tables of your semantic scale question
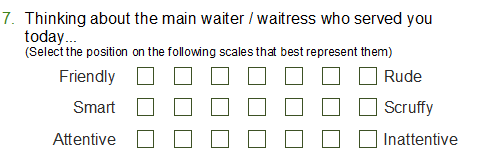
This example shows how to produce holecount and means tables of the responses to a grid of semantic scale questions. It uses the example pictured below from the Crocodile Rock Cafe survey (Q7.a to Q7.c).
Producing a holecount table
This allows you to see quickly how many people have chosen each response.
-
Click
 to display the Analysis Definition dialog for a table.
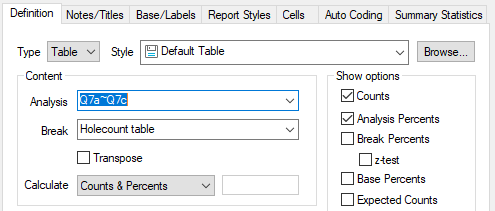
- Add the semantic scale grid variables to the Analysis field. You can add the whole set in the form Q7.a to Q7.c, or you can add individual questions separated by commas.
- Select Holecount table from the dropdown list in the Break field (or type HOLECOUNT or COUNT in the field, in upper or lower case).
- If you wish, select the Analysis percents option to display the percentage choosing each response.
- Click OK to build the chart.
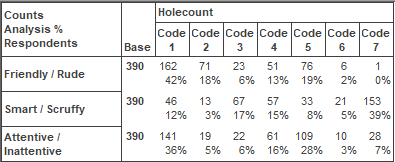
The result is a table showing the number of responses recorded for each of the choices. The example below also shows the analysis percentages.
Producing a means table
A means table gives the average response for each scale question.
-
Click
 to display the Analysis Definition dialog for a table.
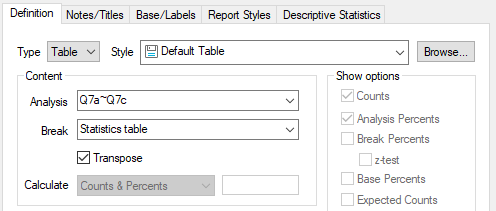
- Add the semantic scale grid variables to the Analysis field. You can add the whole set in the form Q7.a to Q7.c, or you can add individual questions separated by commas.
- Select Statistics table from the dropdown list in the Break field (or type STATS in the field, in upper or lower case).
- Check the Transpose box.
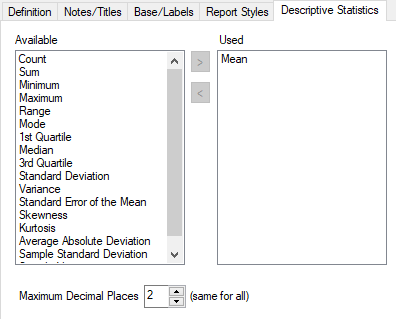
- Click the Descriptive Statistics tab.
- Show only the Mean in the Used pane.
- Set the number of decimal places to 2.
- Click OK to build the chart.
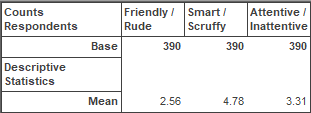
The result is a table showing the means of the responses recorded for each scale.
