Analyzing your survey data
Once you have started to collect some responses to your survey you will want to put this information to use. Analyzing the results can help you understand the responses from your participants.
In the Analyze section you can
- View the standard reports
- View bespoke reports that have been created in Snap XMP Desktop
- View tables and charts that have been created in Snap XMP Desktop
- Update the reports and analyses with data responses as they come in
- Set up filters and contexts
- Download the report to PDF format
- Print reports
There are two ways of navigating to the Analyze section.
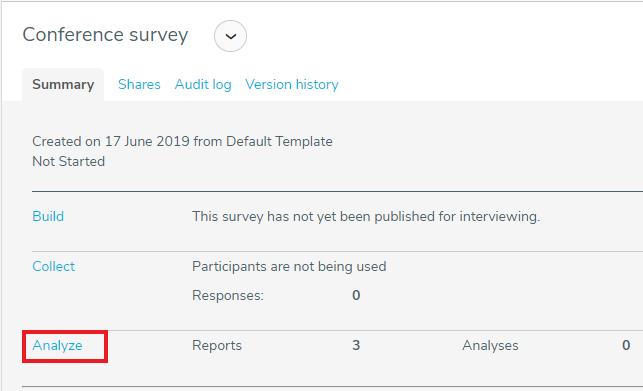
- Click the Analyze link from the Conference survey Summary tab in Your work.

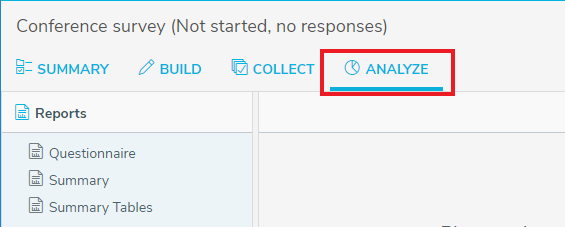
- Click the Analyze tab from the Online Editor.
