Changing the size of charts (and other image analyses) in your report
You can use a window size instruction to set the sizes of images. This ensures that image based analyses (such as charts, word clouds and maps) and text contained within them appear at a predictable size.
A window size instruction defines the relative dimensions of subsequent analyses appearing in the report. The actual pixel dimensions of analyses may change when you resize the analysis.
- Open your report.
- Click New Instruction
 on the toolbar to add a new instruction and select Window Size. The Window Size instruction dialog opens.
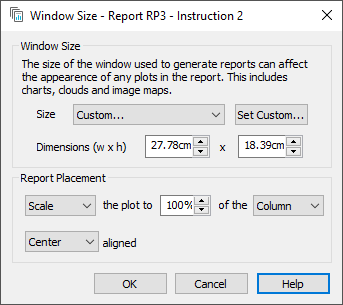
- Enter the dimensions that you would like for your image analyses. Click Set Custom to open an adjustable window where you can specify the size.
- Click OK to add your instruction to the report.
-
Click
 to save the report.
Hints and tips
- To place analyses in the middle of the page, set max scale to 50% – the analyses will expand to fill 50% of the available space, placing it in the middle.
- The screen resolution at which a PDF report is viewed will also affect the appearance of charts.
- Set to standard size unless you are know the size used to view your reports.