Changing the proportions or balance of a sample group
Balancing the sample of data responses allows you to adjust the proportion of respondents in your sample to match more closely the proportion in the target population. This target may align the demographics of the respondents to those in a census or an industry benchmark. For example, you can also set the proportions to show an even distribution for each age range.
Calculate the weighting factors
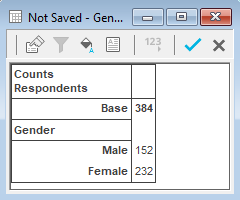
In the example used, there are more female respondents than male respondents, and the instructions show how to change the sample proportions to represent half the respondents as female and half as male, without changing the current base.
- Click
 to display the Analysis Definition dialog for a table.
 - In Analysis, enter the variable that you want to weight. Build the table and note the totals for each code.

- Calculate the Weighting Factors for each code. To calculate the value, divide the target figure (384÷2=192) by the actual figure.
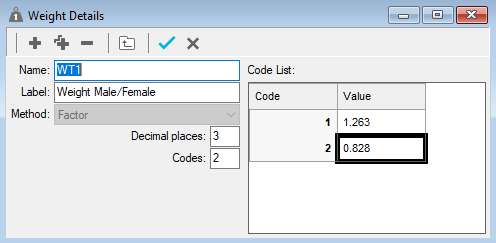
- Code 1, Male = 192 ÷ 152 = 1.263
- Code 2, Female = 192 ÷ 232 = 0.828
Create the weight
- Click
 to display the Weights window.
 - Click
 to add a new weight and specify the Weight Details as follows:
- Name: WT1
- Label: Weight male/female
- Decimal places: 3
- Number of codes: 2

- Click
 to save the weight.
Use the weight in an analysis
- Click
 to redefine the table or
  to display a new Analysis Definition dialog.
 - In Analysis, enter the variable that you want to weight.
- Specify the Weight as WT1 (Q12), which tells Snap to use weight WT1 based on the results for Q12.
- Select the Cells tab. In the Accuracy section set the Calculations d.p. to 3 decimal places to avoid rounding errors.
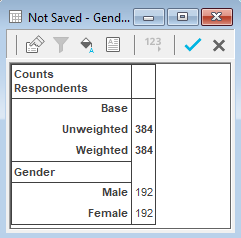
- Click OK to build the table. Check that the table shows the Weighted Values correctly, in this example there should be 103 males and 103 females. Any errors are due to rounding errors or the incorrectly calculated weighting factors.

The table shows the Unweighted Base and the Weighted Base. You can exclude the Unweighted Base in the Tailor | Analysis option.
The weighting can be applied to any other tables and charts. However, there are 2 limitations that multiple-response variables cannot be weighted and you can only use one weight in an analysis.