Chart styles
A chart consists of
- data
- information on how the data is analysed
- information on how the analysis is displayed
The chart is defined in the Analysis Definition dialog where the chart style is selected. The chart style template defines how the analysis data is displayed. There are a number of chart and table styles that are supplied with Snap XMP Desktop. You can adapt these to your requirements using the Chart Designer or create new ones using the Chart Wizard.
The chart style is made up of three components:
- Layout defines how the chart is displayed; type of chart, axes and visibility
- Background defines the color or images used for the chart background
- Series defines the colors used for the different chart elements, such as bars, lines and segments.
Once you have created a chart style, you can save it, and reapply it to other analyses. You can save the style components separately or together.
Note: The number of series colors in your chart style will depend on the chart you have created it from. If you save a style from a chart with four bars (and four separate colors used to identify them) then apply it to a chart with seven pie slices, the colors will repeat.
Selecting a chart style
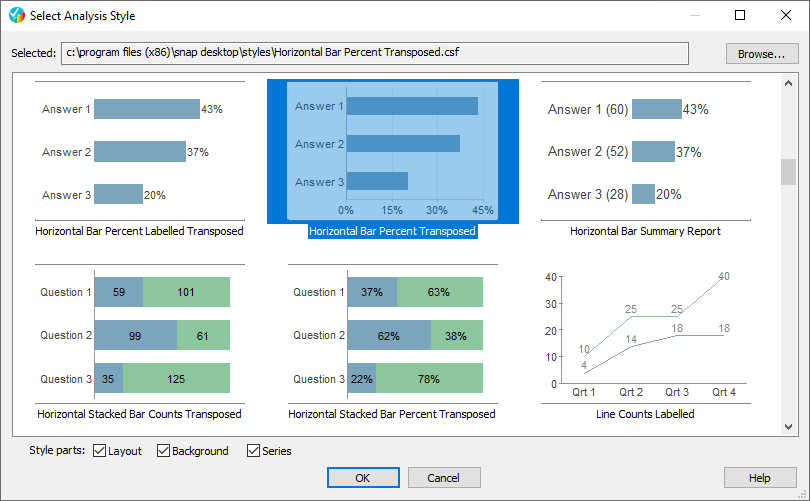
An easy way to select a style of chart analysis is to use the Select Analysis Style dialog. This displays examples of each chart style as a thumbnail image, helping you choose the style you want. The selected chart is highlighted when the dialog is opened.
- On the Snap XMP Desktop toolbar, click Analysis Chart
 to open the chart analysis definition.
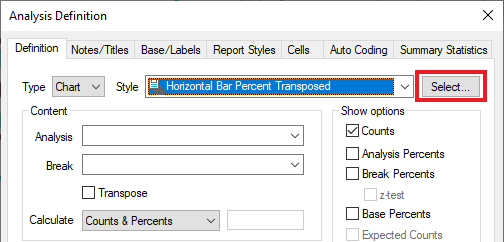
 - In the Analysis Definition dialog, click Select. This opens the Select Analysis Style dialog.

- In the Select Analysis Style list, a thumbnail image is shown for each chart style, helping you choose the style you want. Click on the image of the chart style to use in the analysis.

- If you can’t find a chart style click Browse to search other folders for the style files.
- Select or clear the Layout, Background and Series check boxes to include the parts of the chart style you want to use.
- Click OK to select the chart style.
The chart style can be adapted to your requirements using the Chart Designer. Alternatively, you can create new chart styles using the Chart Wizard.
Further information on using color chart styles can be found in the tutorials:
Using chart style naming
The chart styles that are supplied with Snap XMP Desktop follow a naming convention that can be used to help set up the analysis definition.
If a chart style contains a layout the name starts with the chart type, e.g. Horizontal Bar. Color only chart styles start “Color – ” following by a description.
If the chart style name contains the word:
- Counts then select Counts in the Show Options section
- Percents then select one of the percent options in the Show Options section
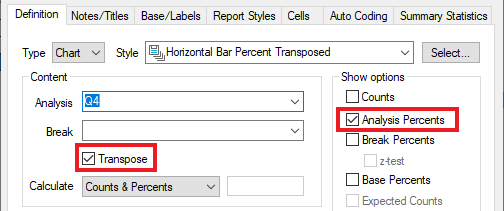
- Transposed then select Transpose otherwise clear Transpose
For example, for the chart style Horizontal Bar Percent Transposed, select the one of the percent options, such as Analysis Percents, and select Transpose.

Saving a chart style
- Make the changes you want to your chart.
- Press F2 or right-click your modified chart and select Save Style from the context menu.
- The Save Style dialog appears.
- Enter a name for your new style.
- In Style parts, Select or clear the Layout, Background and Series check boxes to include the parts of the chart style you want to use. For example, clear Layout and select Background and Series to save the chart colors and background only and exclude the chart type.

- Click OK to save your style.
By default the chart style is saved in the Snap XMP Desktop Styles folder. If you wish to save to a different location, browse to the required folder then save your file.
Note: If you leave the layout box checked your saved style will have all the chart information, not just the background and colors, and you will overwrite the chart types if you load it to a different chart.