Creating a top line analysis of your survey
Snap can display the results of a survey in the form of a questionnaire. This is a clear and easy way of viewing a top-level summary of the survey and can easily be printed. More detailed analyses will then follow in the form of tables and charts.
- Click the
 button on the toolbar to open the Survey Overview window. Double-click the survey, or select the survey and click
  , to open the survey. The Survey Details dialog box will appear.
 - Click OK to open the survey and display the Questionnaire window.
- Click the
 button in the Questionnaire window to switch to Data View Mode.
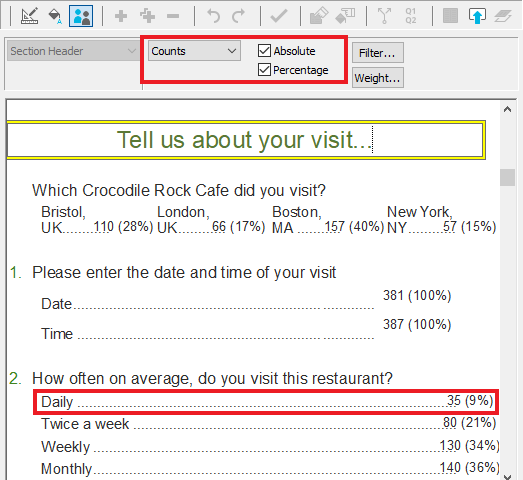
 - Click the drop down showing Case Data, and change to Counts. The number of respondents giving each answer will be shown. For example, 35 respondents visited the restaurant daily.
- Select the Percentage box. The questionnaire will now be presented with the percentage value shown for each of the questions. You’ll now see that the 35 daily visitors represent 9% of our total. Use the vertical scroll bar to view more of the questionnaire.
