Creating a Hi-Lo chart showing maximum and minimum values
Hi-Lo charts can be used to show limited statistics.
-
Click
 to display the Analysis Definition dialog for a chart.
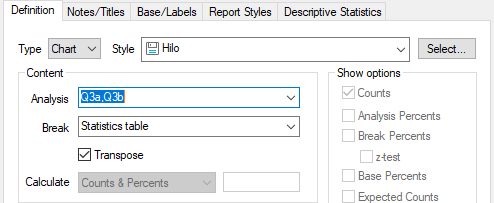
- Add the variables of type quantity to the Analysis field, separated by commas.
- Set the Break to STATS or select Statistics table in the dropdown list.
- Check the Transpose box.
- Select the style Hilo in the dropdown list of Styles. Browse for the style if it is not visible.

- Click the Descriptive Statistics tab.
- Show only the minimum and maximum in the Used pane. (Select all other statistics in the Used pane and move them to the Available pane.)
- Click OK to build the chart.
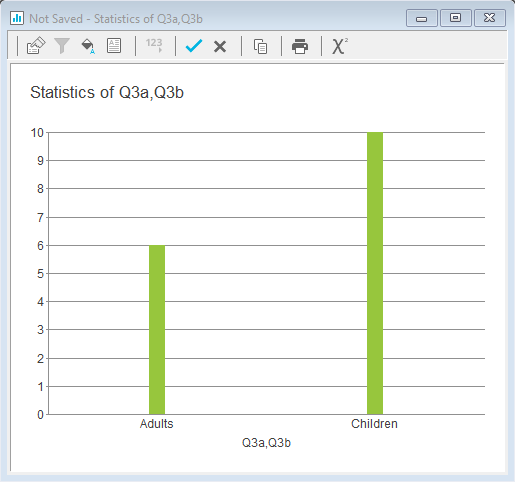
The result is a Hi-Lo Chart showing the highest value recorded and the lowest value recorded for each of the variables.
