Introduction to group variables
You can link similar questions into a group. This means that you can then analyse the group of questions as a whole. For example, if you have a series of questions on aspects of personality, you could group all the questions associated with team working together, and use them as a single axis for tables or charts.
Group variables may be used to create summary analyses of a number of variables which share a common code list such as might be found in a question grid.
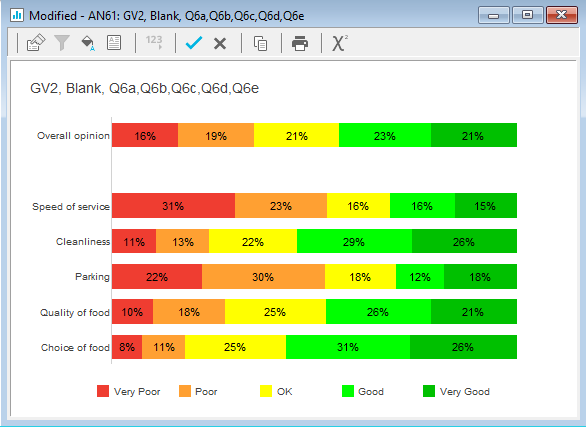
For example, you could create a horizontal stacked bar chart to show the results of respondents’ opinion of five aspects of service offered.
You can use Group variables to include a summary of all five variables in the same chart. All responses will be added together when calculating means, so variables with a larger number of responses will have a larger percentage.
-
Click
 on the main toolbar to open the Analysis variables window.
-
Click
 and select New Group Variable from the drop-down list. The Group Variable Details dialog opens.
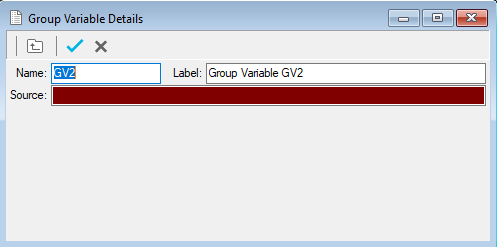
- Give the group variable:
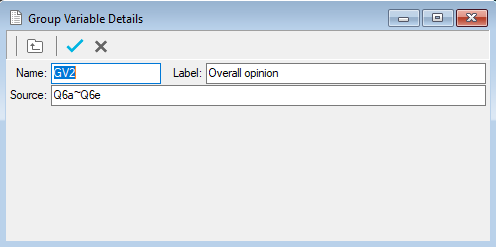
- Name: GV2
- Label: Overall opinion
- Source: list the variables to group e.g. Q6a~Q6e, or Q1, Q5, Q8
-
Click
 to save the variable.
- It appears in the list of analysis variables.
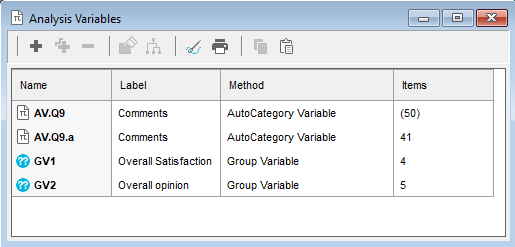
- Click
 to display the Variables window.
 - Click
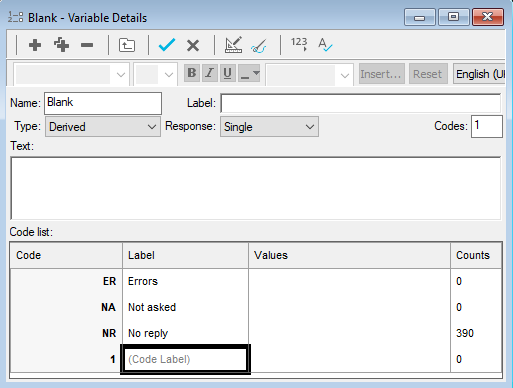
 to add a new variable. This is a blank variable that you can use to insert a blank line in your chart.
 - Specify the Variable Details:
- Name: Blank
- Label: Calculated difference
- Type: Derived (the variable will derive its data from other existing variables).
- Response: Single (there will be one response for each case).
- Click
 to save the new variable.
 - Click
 to build a chart.
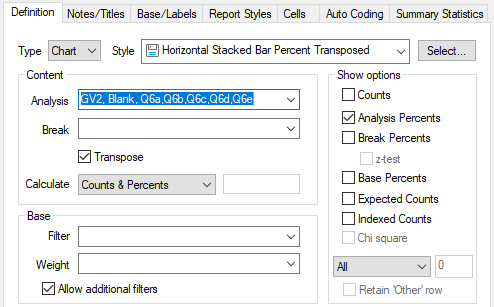
 - Specify the Definition details:
- Style: Horizontal Stacked Bar Percent Transposed
- Analysis: GV2, Blank, Q6a, Q6b, Q6c, Q6d, Q6e
- Transpose: Checked
- Show Options: Check Analysis Percents
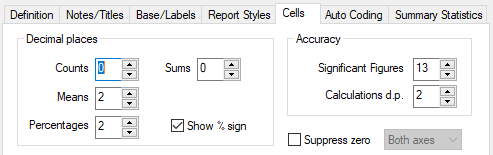
- Select the Cells tab and set the decimal places for the Percentages to 2. This reduces rounding errors when calculating the percentages.
- Click OK to display the chart.