Response profile
When running a survey, you may want to keep track of how many participants have completed the survey, or whether there are particular times that your respondents choose to complete the questionnaire. This can help you improve responses to the survey by sending invitations at certain times or targeting reminders for a particular day of the week. This information is available in the survey’s Response Profile.
Viewing the Response Profile
To view the Response Profile:
- Select the survey from Your work. This shows the Summary tab, by default.
- Select the Response Profile tab to view the response profiles of the participants and completed responses.

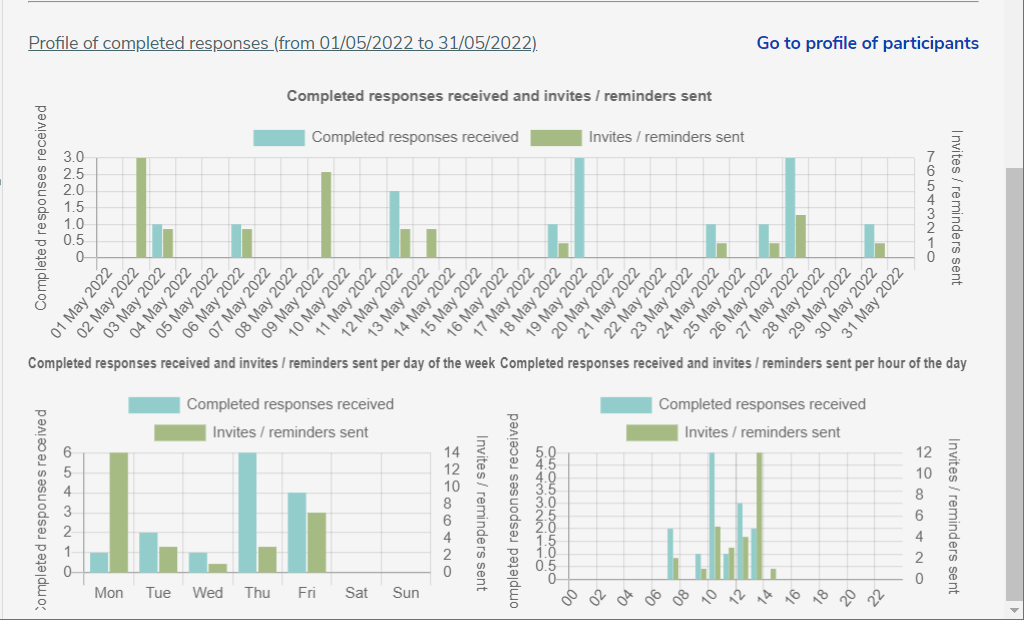
The Response Profile shows two profile sections:
- Profile of participants showing the current status for all participants, with the proportion of survey responses that are not started, started or completed.
- Profile of completed responses showing the profile of completed survey responses, with graphs of the date, day of the week and hour of the day that the responses were completed, and when invitations or reminders were sent.
Profile of participants
This section is only available for surveys that use participants. This section shows the current status for all participants. The graph shows the percentage of survey responses for each status: not started, started or completed.

The scale shows approximate percentage. Place the mouse cursor to hover over the graph to see the exact percentage of participants at each stage.

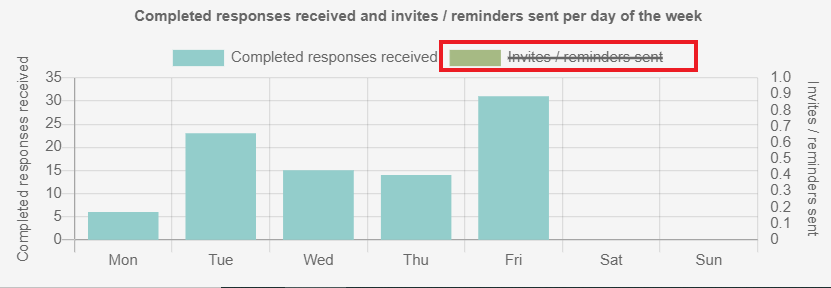
You can click the participant completion status labels to add or remove the participants with that status. The label has a line through it when the graph does not show that data.

Profile of completed responses
This section is available for all surveys. This section shows the profile of completed responses received and invites and reminders sent.

There are three graphs showing the number of completed responses received or invitations sent over the selected date ranges for:
- the date
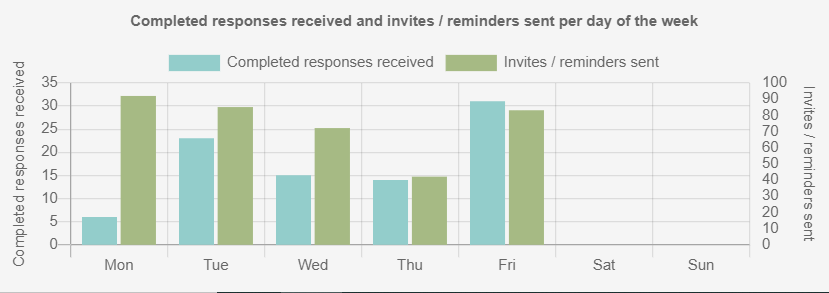
- the day of the week
- the hour of the day
For each graph, click the labels for the completed responses received, or the invites and reminders sent, to show or hide the appropriate data. The label has a line through it when the graph does not show that data.
Selecting the date ranges
When you enter a date range, this shows the survey response profile for the selected range. You can drill-down to see the responses over specific dates especially over busy periods.
- In the Show drop-down, select the date range. You can select from This month, Last month, Choose dates, All time, Last 7 days, Last 30 days.

- If you select, Choose dates
- In From, enter a start date, either by entering directly in the text box or by clicking the calendar icon and selecting the date.
- In To, enter an end date, either by entering directly in the text box or by clicking the calendar icon and selecting the date. The end date must be on or after the start date.

- Click the Refresh button. This updates the data in all the graphs in the completed responses profile.
The response profiles use the time zone of the survey.
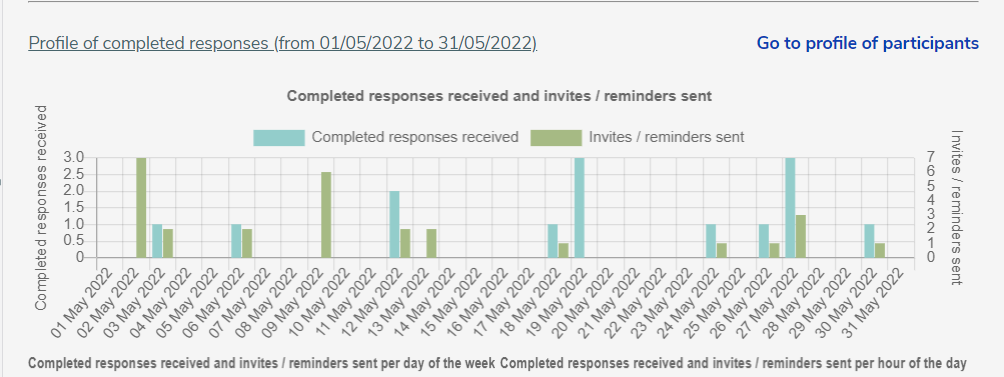
Completed Responses profile graph by date
This graph shows the number of responses that the respondents completed on a specific date over the selected date range. It also shows the number of invitations and reminders sent on a specific date over the selected date range. The date range shown on the horizontal axis is that selected in the Show drop-down.
Completed Responses profile graph by day of the week
This graph shows the number of responses that the respondents completed on each day of the week over the selected date range. It also shows the number of invitations and reminders sent on each day of the week over the selected date range.
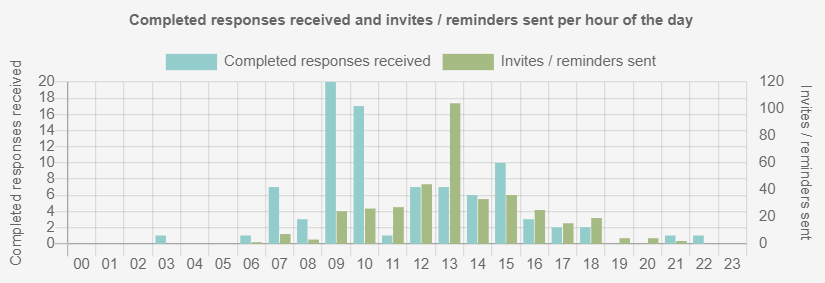
Completed Responses profile graph by hour of the day
This graph shows the number of responses that the respondents completed for each hour of the day over the selected date range. It also shows the number of invitations and reminders sent for each hour of the day over the selected date range.
