Using a weight to convert responses into numerical values
You may wish to further analyse questions by converting the response given into a numerical score, and using this to provide summaries of respondents’ answers. The example shows how to convert a ratings scale into a numerical value, so you can get an average value for the qualities that are being rated.
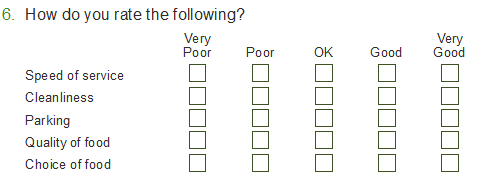
The questions to be scored are 6.a to 6.e in the Crocodile Rock Cafe survey.
- To check which question this is, open the Crocodile Rock Cafe survey and scroll down to question 6.

-
Click
 or press Ctrl+R to open the variables window.
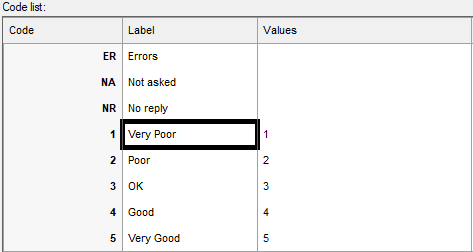
- Find the grid questions and look at the Code list so you know which labels seen by the respondent are assigned to which codes.

- Open the Weights window by clicking
 or pressing Ctrl+W.
 - Click
 to add a new weight and specify the Weight Details as follows:
 - Name: scoreSat
- Label: Satisfaction score -2 to +2
- Decimal places: 3
- Number of codes: 5
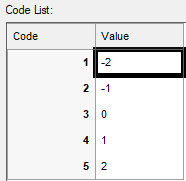
- Specify the Code Details

-
Click
 to save your weight.
Using the score in analysis
-
Click
 to open the Analysis Definition window for a table.
- Set the analysis value to be Q6.a ~Q6.e (this includes all questions from Q.6a to Q6.e)
- Select the Summary Statistics tab and move Mean from the Available column into the Used column. Type the name of your score (scoreSat) in the Summary Score box. This tells Snap to create a summary of your analysis, scoring the codes with the specified values.
- Click OK to display the table.
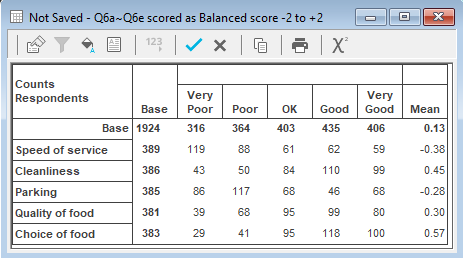
- There is a column displaying the mean scored values.

The top line (Base) shows the total number of all respondents for all the questions. The mean satisfaction of everyone with all the services is 0.13.
The other rows show the average satisfaction for each service. You can see that people are generally positive about the Cleanliness, Quality of food and Choice of food and unhappy about the Speed of Service and Parking.
Including Don’t Know responses
When the question contains a Don’t Know response you can choose to include these responses in your analysis or exclude these responses from the analysis.
- Including the response add a score, such as 0, for the code associated with the Don’t Know response
- Excluding the response set the score to NR to give it a score of No Reply. This means that it won’t affect the analysis