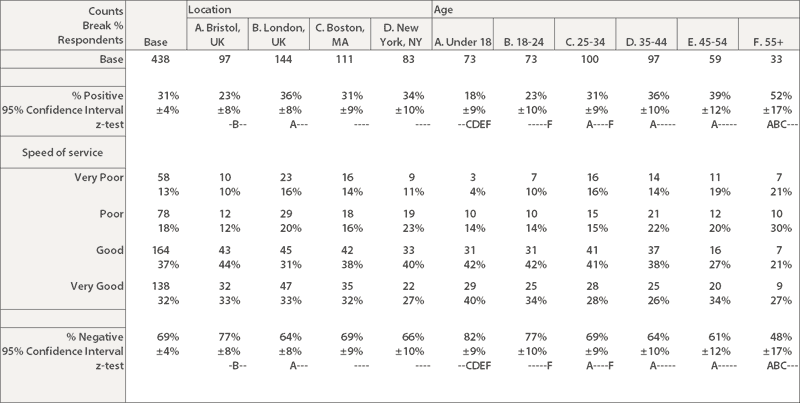
Statistics help condense and present data in a manner understandable by everybody, and are an integral part of any research project. Snap Survey Software includes a range of statistical tools to help you understand your data and make the right decisions, including:
- Factor analysis – Categorize data into recognizable themes.
- Cluster analysis – Identify ‘clusters’ in the data that have unique and identifiable characteristics.
- Z test – Compare two percentage scores to see if the difference is statistically significant.
- T test – Compare the means of two groups to see if the difference is statistically significant.
- U test – Compare median scores of axis-defined groups to see if the difference is statistically significant.
- Gap analysis – Compare results and identify priorities for improvement.

Descriptive Statistics
A range of Descriptive Statistics is also available, including:
- Mean, Mode, and Median.
- Quartiles.
- Minimum, Maximum and Range.
- Standard Deviation, Variance and Standard Error.
- Skewness and Kurtosis.